company-logoresearch-logo
1 min read
25 Jun 2021

The regulated tail that wags the honey badger?

Last year’s main story was the growing institutional adoption of bitcoin amid a period of unprecedented fiscal and monetary stimulus globally. 2020 was a year with increased presence from institutional investors in bitcoin, but to what extent?
GIS+main.png
Key findings:
  • The regulated bitcoin futures on CME has a far more pronounced price leadership role in bitcoin’s price discovery now, compared to back in 2019.
  • We argue that due to the more pronounced leading role of the CME futures, the SEC should consider approving the pending bitcoin ETFs. The market has matured, and U.S. retail investors deserve a viable exchange-traded investment option for their 401Ks.
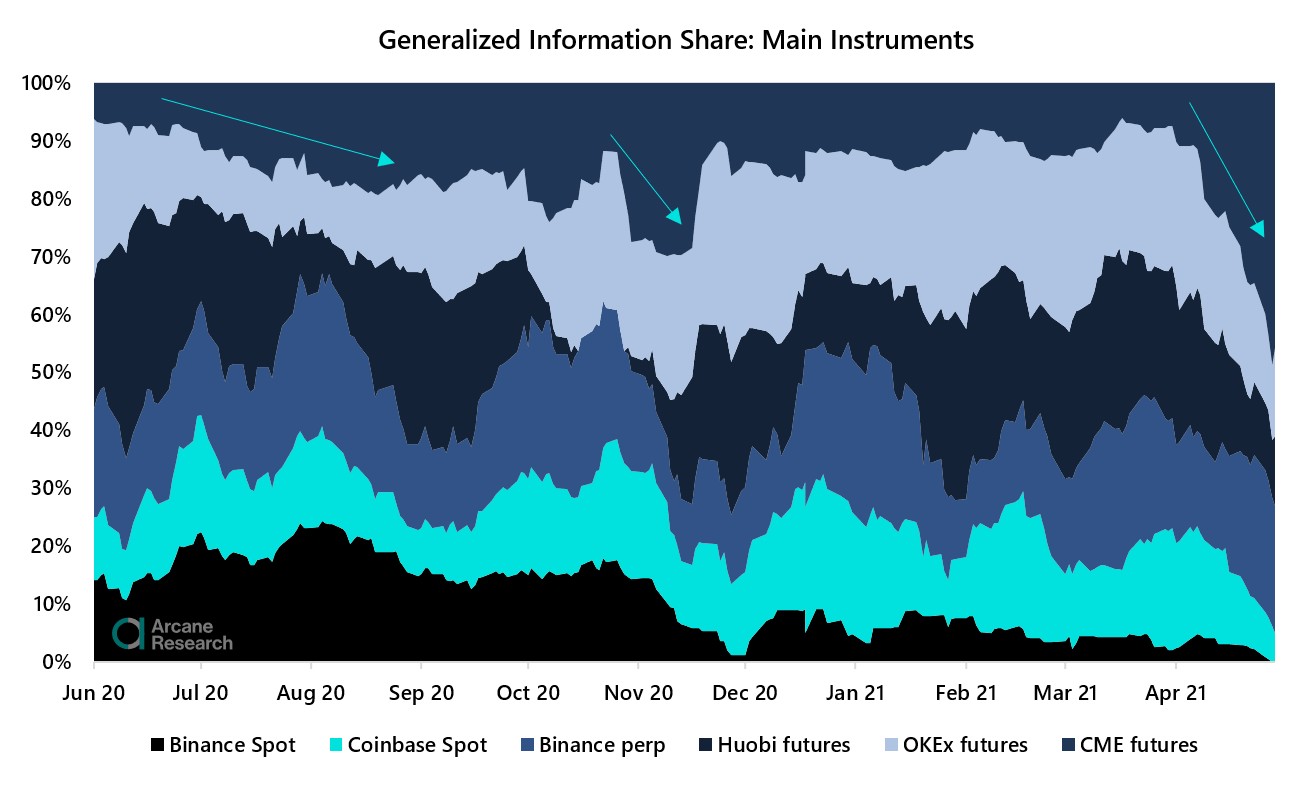
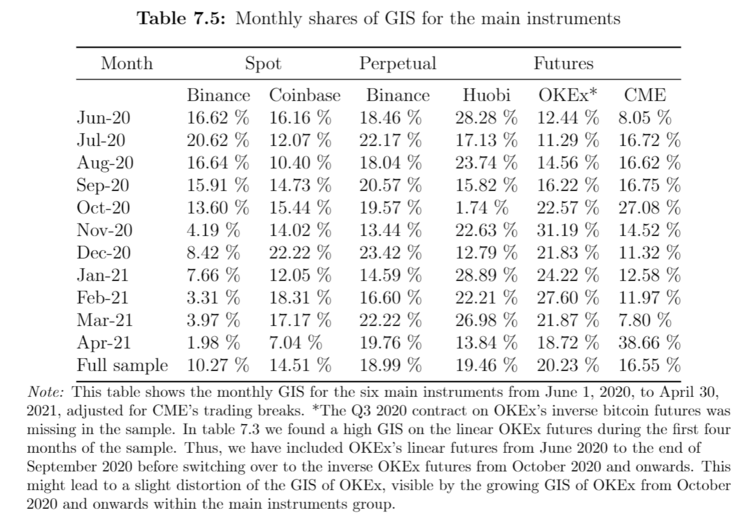
This article draws on data from a price discovery analysis performed by Jens Vig and Vetle Lunde titled “The regulated tail that wags the honey badger”. The analysis set out to identify the impact of the increased institutional presence in bitcoin by performing a multivariate price discovery analysis from June 1st, 2020, till April 31st, 2021. The analysis sought to identify how important the regulated futures market has become in bitcoin and contrast it to a similar analysis conducted by Carol Alexander and Daniel Heck for 2019. The Alexander and Heck paper can be found hereWhile examining the role of the regulated futures market, the most important instruments in leading the direction and amplitude of the bitcoin price movements within the spot market, the unregulated futures market, and the perpetual swaps market were also identified. These results are disclosed in the appendix of this blog.Why identifying the role of the regulated futures market is relevant - and important!There are several reasons as to why understanding the role of the regulated futures market is important in bitcoin. Firstly, the risk of market manipulation and the strength of the unregulated futures market has been one of the forces leading the SEC to reject previous ETF proposals in bitcoin. Secondly, price discovery varies across time. By analyzing the time series and monthly information flows in various instruments, we may identify certain periods where institutional investors on CME had a particularly strong grip on the price discovery in bitcoin. This analysis finds strong indications of a more pronounced leadership role for CME from June 2020 to April 2021 than what was uncovered in Alexander and Heck’s paper from April 2019 to January 2020. In October 2020 and April 2021, CME’s bitcoin futures was the leading instrument in the entire bitcoin market. This could suggest that institutional buying pressure was the main contributor to bitcoin’s bullish momentum going into Q4 2020. Further, it suggests that institutional selling pressure was the main contributor to bitcoin losing its bullish momentum in April 2021. Due to CME’s significant role in the price discovery of bitcoin, the paper argues that the SEC should consider approving the pending ETF applications. The market has matured, and U.S. retail investors deserve to have the option to invest in a bitcoin investment product in their 401Ks without a fluctuating premium or discount to the NAV (like we have seen with Grayscale’s GBTC).This blog post contains a *very* superficial explanation of the price discovery metric used in the research piece before illuminating the actual observations in the following paragraphs. The charts are relatively intuitive but beware that during the sample period, data were missing on certain occasions from several instruments. This could, to some extent, impact the quality of the conclusions derived from the analysis. We are happy to elaborate on the research process, our conclusions and provide the full paper once it is published.  DataThe analysis examined the process of how new information is impounded into the bitcoin market, more commonly known as the price discovery process. By using GIS (Generalized Information Share), a multivariate sample of 21 different bitcoin price pairs from three sectors were analyzed:1) the spot market2) the futures market3) the perpetual swaps marketThe research was conducted on minutely trading data for all 21 instruments from May 14th, 2020, to May 7th, 2021, summing up to around 9 million observations. The leading instruments from each sector were included in a final price discovery analysis covering the main instruments from each group, in addition to the regulated futures on CME. The Generalized Information ShareThe generalized information share assumes that in the long run, instruments covering the same underlying asset (in this case, bitcoin) converge towards equilibrium of one common implied efficient price. It identifies the relative contribution of a certain instrument to the innovation in the price discovery of an asset, leading to one common implied efficient price. The GIS translates the relative contribution (from 0 to 100%) of an instrument to the implied efficient price. By using minutely trading data on bitcoin, this metric enables us to get an understanding of which instruments contribute the most to bitcoin’s price discovery, and therefore which instruments are most influential over time. What you should know is that GIS is a tool enabling us to identify the most relevant and important financial instruments to the price movements of an asset. It does so in an easily quantifiable way by illustrating the relative contribution an instrument has to the price discovery of the underlying asset. In its essence, a higher GIS indicates higher importance of the instrument in the price discovery process in bitcoin.The research followed the same methodology as Carol Alexander and Daniel Heck used in their analysis, covering the price discovery in bitcoin from April 1st, 2019, till January 31st, 2020. The results from the recent analysis are compared and contrasted to the results from this paper in order to understand how the market has evolved over the last year.This blog post serves the purpose of illuminating the key observations of the role of CME from the research paper. The other results are highlighted in the appendix.Price discovery in Bitcoin: The role of CMEThe main instrument analysis indicates a far more pronounced leadership role of CME from June 1st, 2020 till April 30th, 2021, than what was uncovered by Carol Alexander and Daniel Heck from April 1st, 2019, till January 31st, 2020. However, our results align with those of Alexander and Heck in that the Huobi and OKEx futures are the leading instruments in bitcoin’s price discovery.The main instrument GIS analysis is performed on the stablecoin spot pair from Binance, Coinbase’s BTCUSD spot pair, Binance’s stablecoin margined perp, the Huobi futures, OKEx futures, and the CME futures. As illustrated in the appendix, these instruments were elected due to their leading roles within their respective markets.Figure 1
GIS+main.png
Preview
Figure 2
GIS+table
Preview
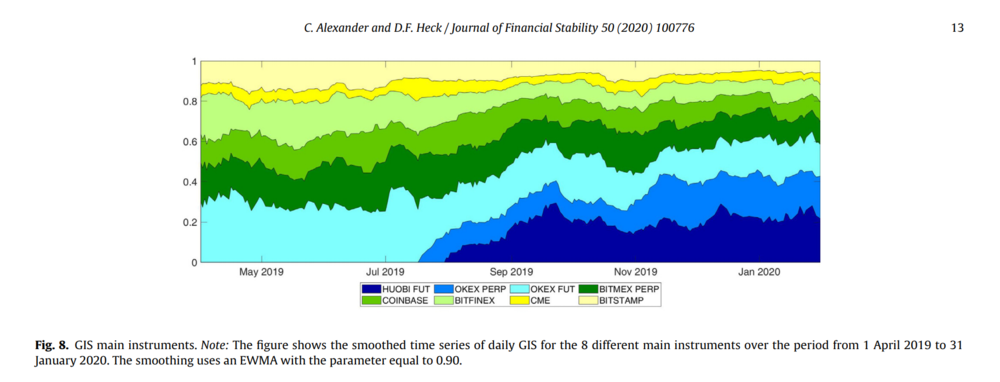
The figures above and below illustrate the time series of the GIS for the most important trading instruments in bitcoin. Figure 1 and 2 illustrates the GIS from June 2020 until April 2021. Throughout this period, CME had a full sample GIS of 16.55%. Also, note that CME had the highest GIS of all instruments in both October 2020 and April 2021, indicating that CME was the leading instrument in bitcoin’s price discovery in these months. Figure 3 and 4 illustrates the results of Alexander and Heck’s price discovery analysis for 2019. In 2019, the GIS of CME fluctuated around 5%, considerably lower than most spot and unregulated futures instruments. This implies that in 2019, the CME futures mainly reacted to price movements in other instruments, whereas, in 2020 and 2021, price movements on CME had a more significant contribution to the price discovery in bitcoin. Figure 3
Gisc
Preview
Figure 4
Gis+c
Preview
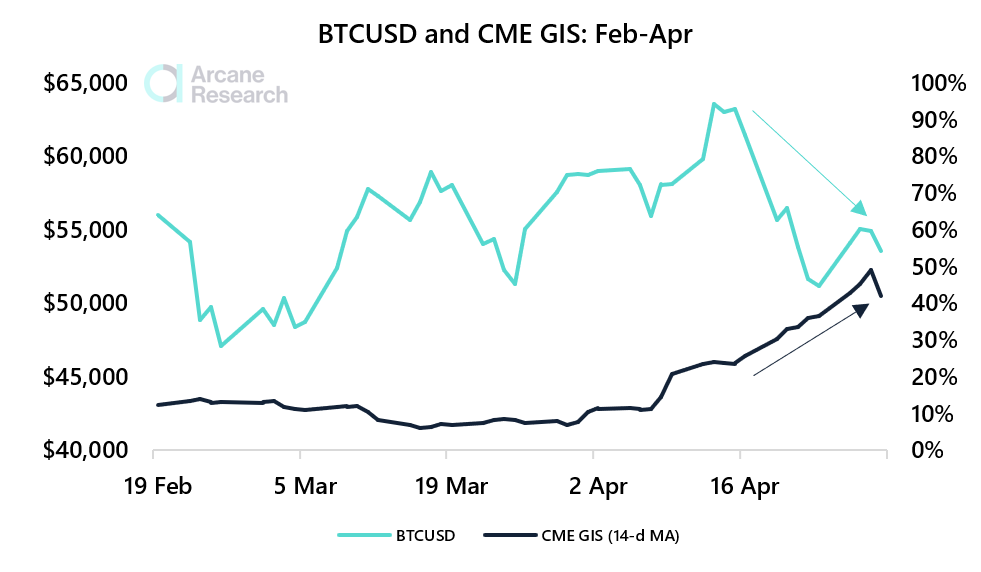
In the Alexander and Heck paper from April 2019 to January 2020, the monthly average GIS of the CME futures fluctuated between 3% to 9% while averaging at around 5% throughout the time series. From June 2020 to April 2021, however, the GIS of the CME was substantially higher. The monthly GIS fluctuated between 8% and 39%, with an average full sample GIS of 16.5%. This clearly indicates that the regulated bitcoin futures on CME has a far more pronounced impact on bitcoin’s price discovery recently than in 2019. In other words, from April 2019 to January 2020, the bitcoin futures on CME mainly reacted to the price movements of other instruments. Whereas, now CME in periods tend to lead bitcoin’s price movements. This indicates that the institutional footprint in bitcoin is strong.Institutionally led sell-off?Interestingly, CME’s monthly GIS in April 2021 is the highest monthly GIS measured in any of the instruments for the entire time series. The 14-day moving average GIS of CME reached 48% by the very end of the sample period. We all know what happened at the end of April – bitcoin lost its upward momentum. As illustrated in the chart below, the GIS of the CME futures climbed as the bitcoin price fell. This could indicate that institutional selling pressure led to bitcoin losing its momentum. On the other hand, the growing leadership role of CME in April could also be caused by exaggerated intraday price swings in the other futures and perpetuals instruments caused by massive amounts of leverage.
feb
Preview
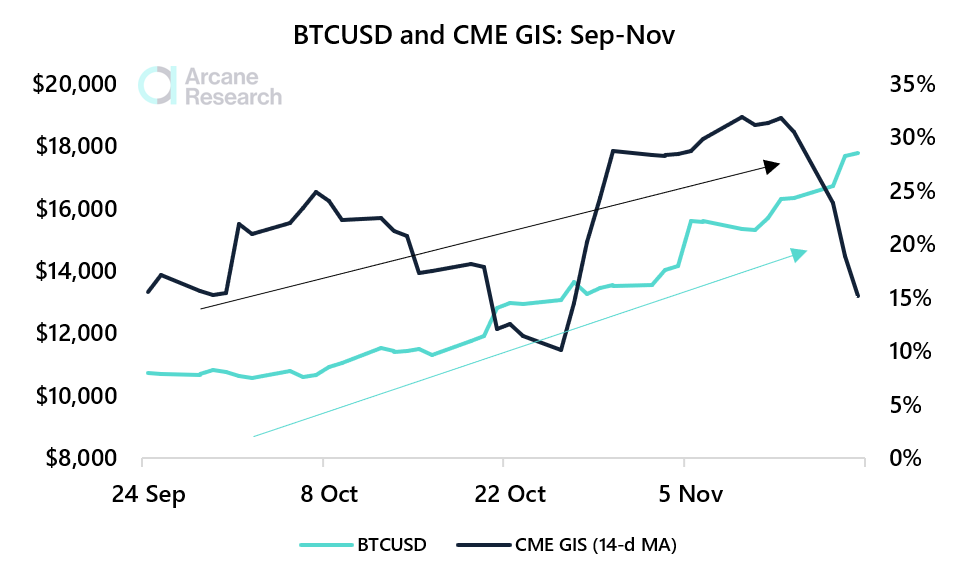
October, an institutionally driven build-up to the bull market?Similarly, CME had a high monthly GIS in October at the beginning of the bitcoin bull market. As illustrated in the chart below, the CME GIS moved in tandem with bitcoin’s appreciation in value. This indicates that institutional buying pressure was an important catalyst for the bitcoin bull market.
Sep
Preview
In their paper, Alexander and Heck used their observations from 2019 to refute ETF, arguing that the insufficient stability of the bitcoin market and inconsistent regulation globally left the market vulnerable to market manipulation. This analysis, however, shows that the regulated futures market has become an integral part of bitcoin’s price discovery in the last year. Therefore, the paper concludes that the SEC should consider approving an ETF this time around. Another argument in favor of an ETF approval is the fact that U.S. retail investors seeking to allocate savings from their 401Ks already have certain investment vehicles to choose from. However, these funds are, in the opinion of the researchers, unfair and inferior to an ETF as they regularly see large fluctuations in their share price to their NAV. This, in turn, adds a layer of uncertainty for those who invest in the trusts. The author's position on this matter is that further ETF rejections carry more harm than good. U.S. retail investors deserve a well-structured bitcoin ETF. Originally written as a Master’s Thesis at the Norwegian School of Economics by Jens Vig and Vetle Lunde. The full study will be available later. APPENDIX - For those who are particularly interestedKey findings, rest of the study
  • Huobi and OKEx’s instruments seem to be the most important instruments within bitcoin’s price discovery from June 1st, 2020, to April 30th, 2021. This is similar to the findings of Carol Alexander and Daniel Heck when analyzing May 1st, 2019 to January 31st, 2020.
  • CME and Binance bitcoin perpetuals also have a significant contribution to the price discovery in bitcoin, with CME seeing a very dominant role in April, indicating that the recent sell-off could be caused by institutional selling pressure.
  • Binance is by far the leading perpetuals instrument (within the perpetuals market), while Bybit seems highly insignificant despite its high trading volumes and open interest. FTX’s importance is growing.
  • In the unregulated futures market, OKEx and Huobi’s instruments are the most important futures instruments. Deribit has surprisingly strong information leadership given its low trading volume, possibly driven by price discovery occurring in Deribit’s options market
  • In the spot market, Binance’s stablecoin pair dominates, and Coinbase follows. However, when analyzed together with the main instruments from each sector, Binance’s stablecoin pair is almost completely irrelevant in the last months of the sample.
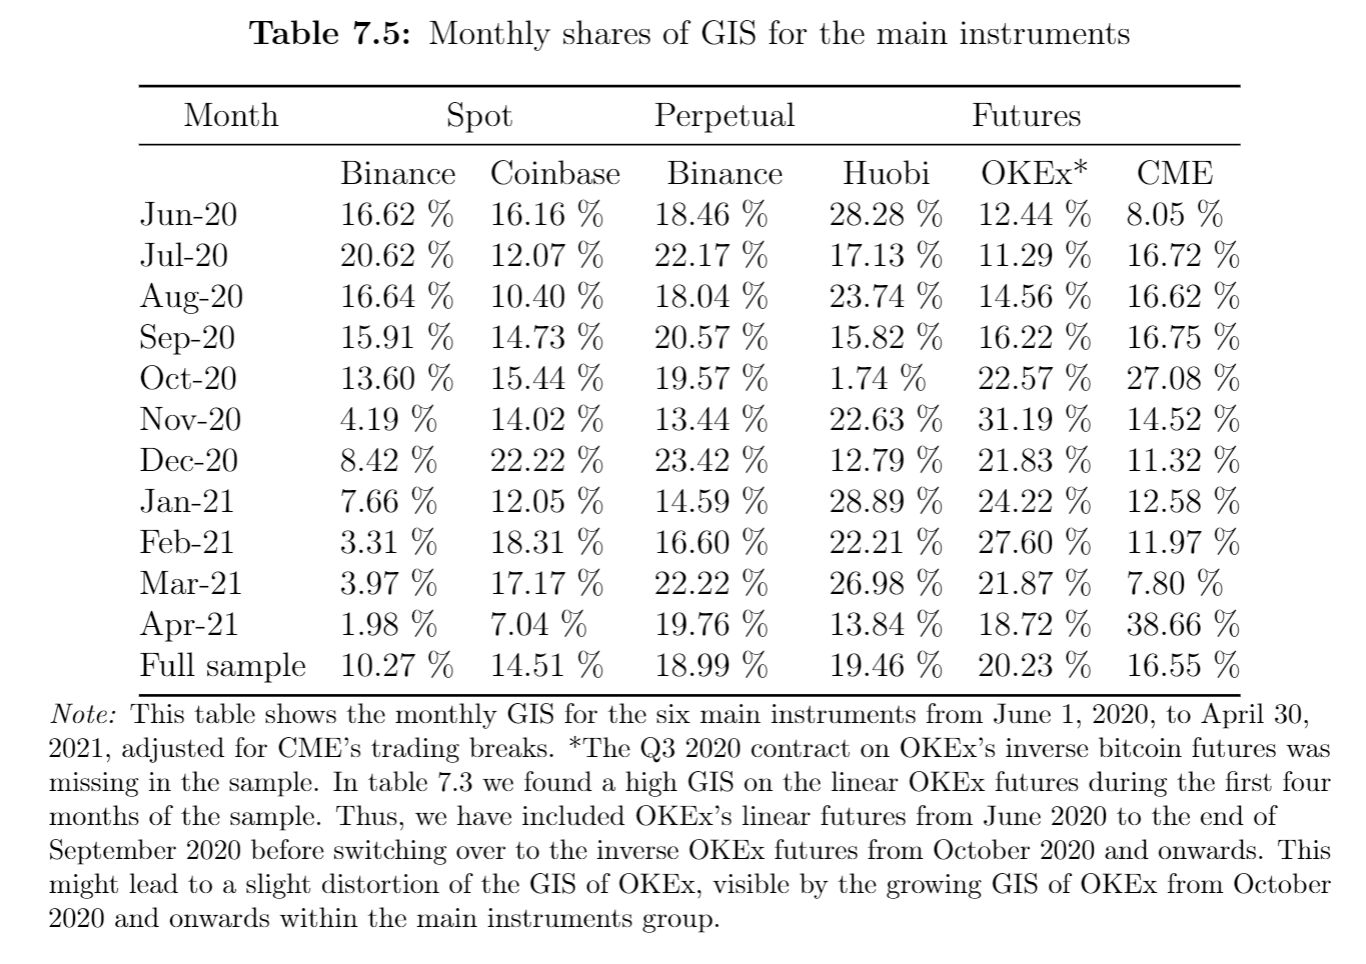
Further results from the main instrument analysisThe price discovery analysis indicates that OKEx’s bitcoin futures lead bitcoin’s price discovery, with the Huobi futures following closely. The inverse bitcoin futures on OKEx accounted for between 18% to 31% of the monthly GIS across all the main instruments, and OKEx led the market in two of the eleven months analyzed. The GIS of the Huobi futures fluctuates between 14% and 28%, with an outlier in October of 2% due to low-quality data. In total, the Huobi futures led the price discovery in bitcoin in four out of eleven months analyzed.
GIS+table (1)
Preview
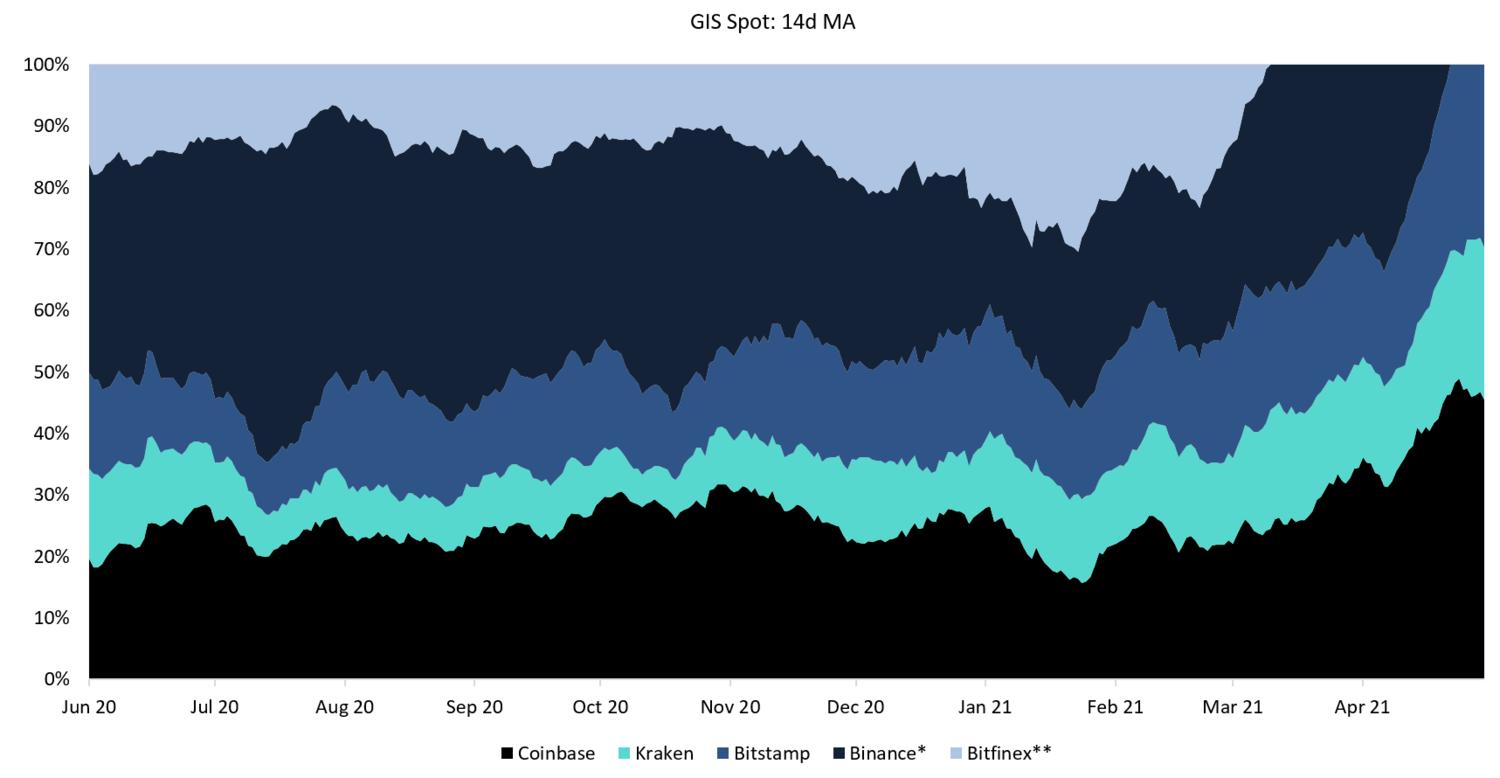
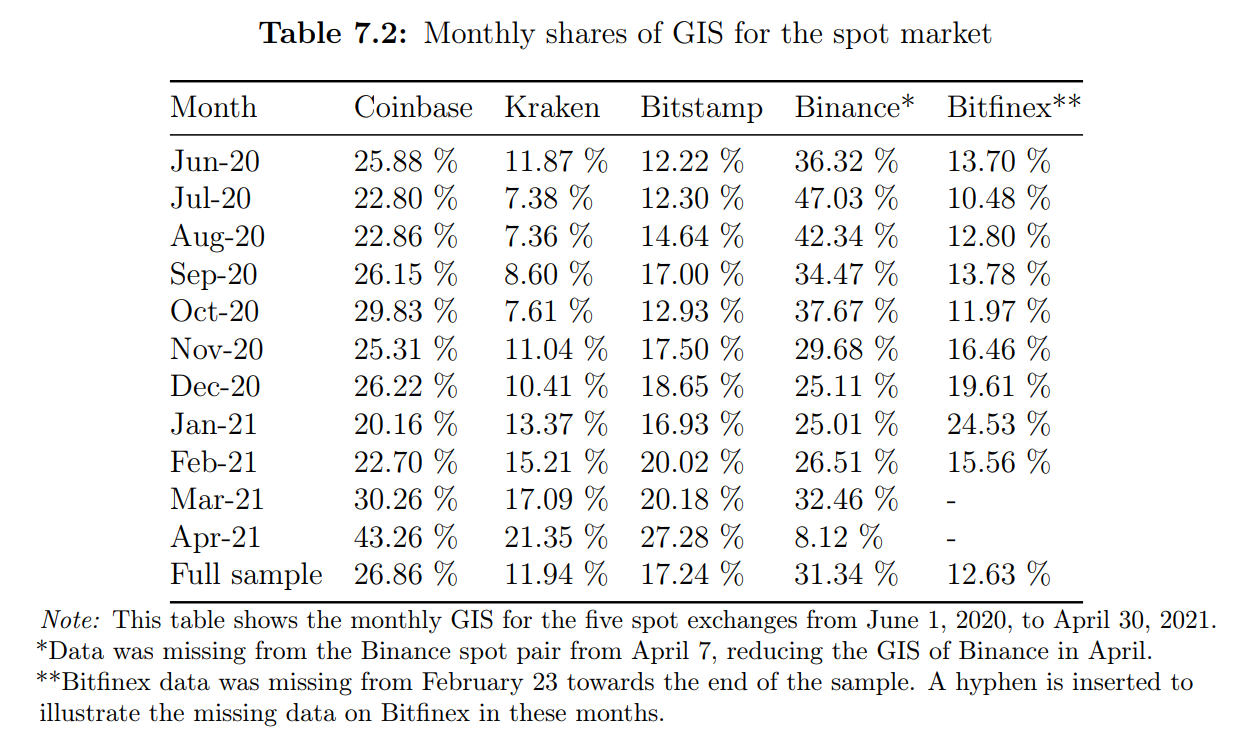
Binance’s perpetual has also played a significant role in bitcoin’s price discovery, leading the market in three out of eleven months, with a GIS fluctuating between 13% and 23%.Binance’s stablecoin denominated pair dominated the price discovery within the spot market, as illustrated in the appendix. However, within the main instruments, the Binance stablecoin denominated pair seemed rather unimportant in bitcoin’s price discovery, with a low GIS indicating that the BTCUSDT pair on Binance mainly follows the price movements of the other instruments analyzed. Coinbase’s spot pair, on the other hand, had a more important role in the price discovery of the main instruments.Intuitively these results make sense. Activity in the Coinbase spot pair is in part driven by new dollars entering the system, whereas the Binance USDT pair is not. Most new buyers seeking to convert fiat currencies to bitcoin will go through one of the “fiat gateways”, such as Coinbase. Likewise, a large seller seeking to realize profits will sell on fiat gateways. Investors buying or selling through stablecoins could be motivated by other factors, such as collateralizing leveraged derivative trades or investing in other cryptocurrencies. Investments coming from the outside of the system are intuitively more likely to lead to price movements impacting the broad market than investments coming from within.Price discovery within the spot marketHere are the results from the price discovery analysis within the spot market. The results indicate, unsurprisingly, that Binance’s stablecoin spot pair and Coinbase’s BTCUSD pair are the leading pairs in the spot market.
gis+spot
Preview
gisspot
Preview
To little surprise, Coinbase’s BTCUSD spot pair and Binance’s stablecoin denominated BTCUSDT pair were the dominating instruments in the spot market from June 1st to April 30th. Binance data was, unfortunately, missing from our dataset from April 7th.However, in 9 out of 10 months, with full data available on Binance’s BTCUSDT pair, Binance was leading the spot market in terms of GIS. Binance saw its GIS trending downwards from June, heading into Q4 2020 and Q1 2021, but remained highly relevant throughout the sample.Coinbase only led the market once, in December, which could be caused by an inflow of institutional buyers in the latter part of Q4, 2020. However, Coinbase had a high contribution to the GIS in all months analyzed and is evidently a very important instrument in the price discovery within the spot market.Kraken and Bitstamp have played a minor role in the price discovery within the spot market, suggesting that these spot pairs tend to follow the movements of other spot pairs. Meanwhile, Bitfinex saw its GIS trending upwards towards the middle of the sample period, which could indicate that the Bitfinex market has a substantial impact on the price discovery process within the spot market.Coinbase and Binance’s dominating role in the price discovery within the spot market is worth examining further, both due to their substantial GIS and also due to the fact that they reflect different underlying currencies. The results indicate that both instruments have an important role in bitcoin’s price discovery. Thus, both instruments were elected to the final GIS-model scoping the most pronounced leading instruments within each group.Price discovery within the unregulated futures marketThe research further analyzed the GIS within the unregulated futures market and uncovered that OKEx and Huobi have the leading instruments in terms of price discovery within this market.
gis+futures
Preview
gisfut
Preview
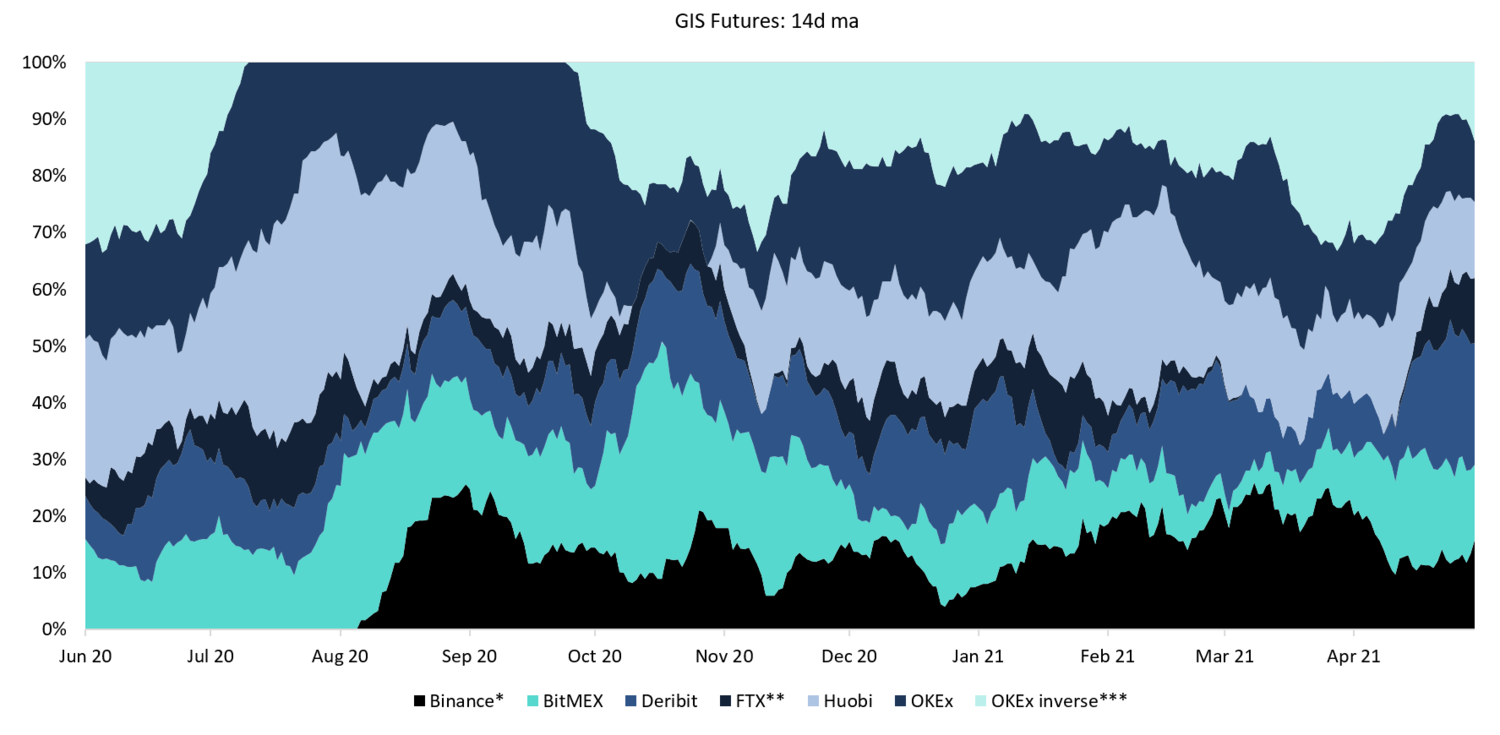
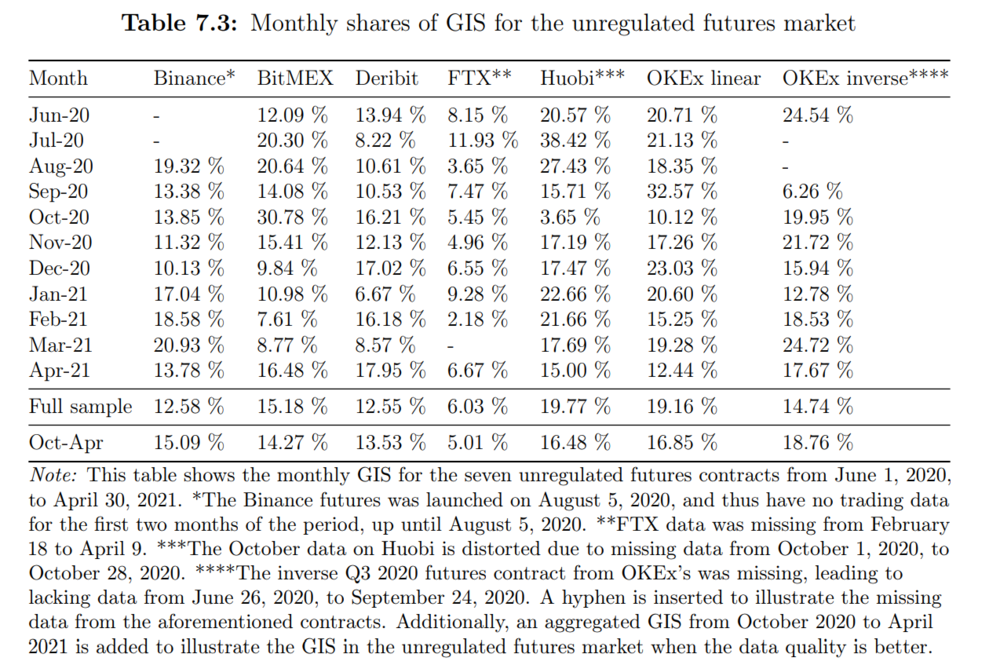
Unfortunately, the research missed some data from the futures market. OKEx’s inverse Q3 futures was missing entirely from the dataset, while FTX data was missing in the latter part of the sample. The Binance futures was launched in August.The results from this research suggest that Huobi and OKEx are the leading instruments within the unregulated futures market. Huobi held the highest share of the GIS in three of the ten months analyzed, whereas OKEx’s inverse contract led in three instances. OKEx’s two futures instruments and Huobi’s instrument combined accounted for 52% of the GIS for the entire duration of the sample. The leadership from these instruments is unsurprising. Empirically, instruments with high trading volumes and frequent trading tend to lead the price discovery of an asset.However, more surprisingly, Deribit’s futures market seems to have a relatively high impact on the price discovery within the futures market, despite comparably low trading volumes. We ascribe this to Deribit’s market-leading role within Bitcoin options trading. Deribit had a strong grip on the options market, accounting for nearly 90% of the OI in the options market throughout the sample period. Deribit’s options use the futures as the underlying settlement, and activity in Deribit’s options could affect the information flow to the underlying futures.Nevertheless, the dominance of OKEx and Huobi is clear from the data, and these futures were therefore added to the main instrument section. Price discovery within the perpetual swaps marketThirdly, the price discovery within the bitcoin perpetuals was analyzed using the day-by-day price discovery of the dominating instruments in the market.
gisperps
Preview
gis+perps
Preview
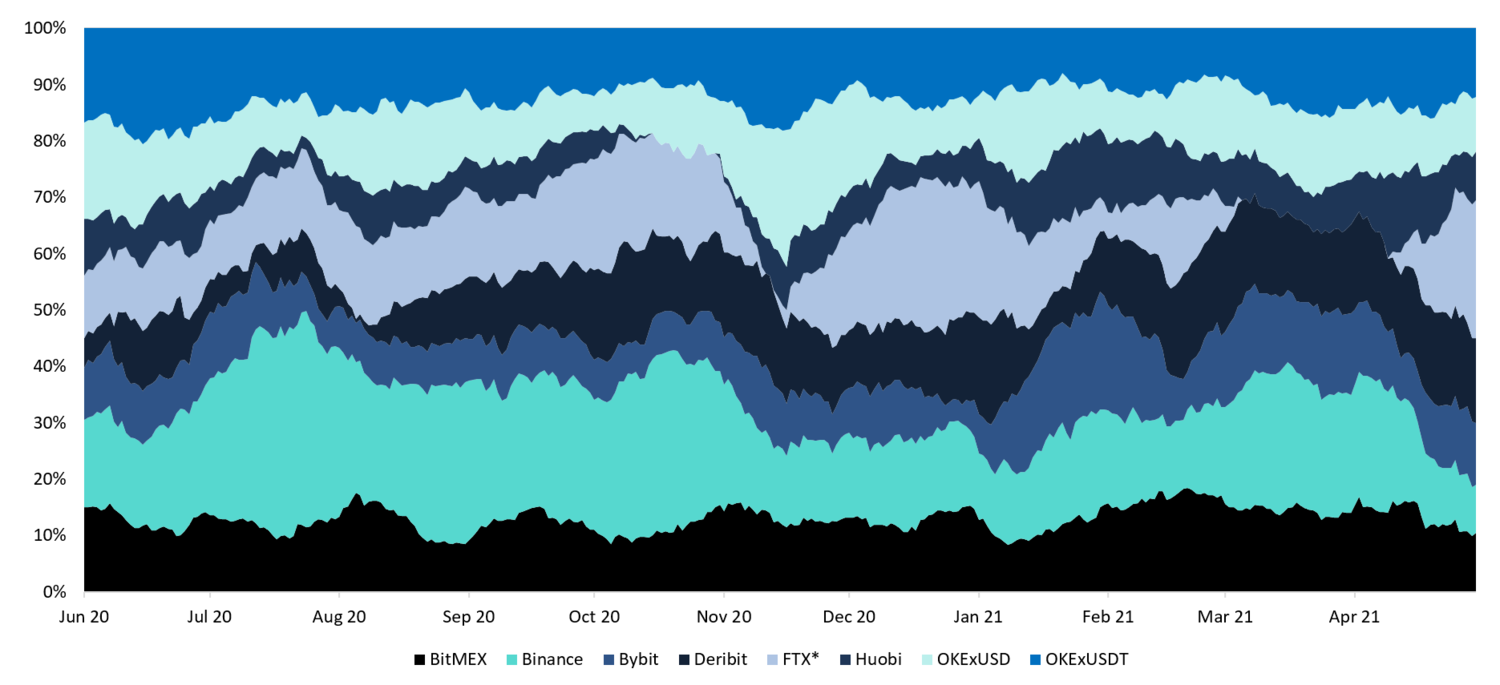
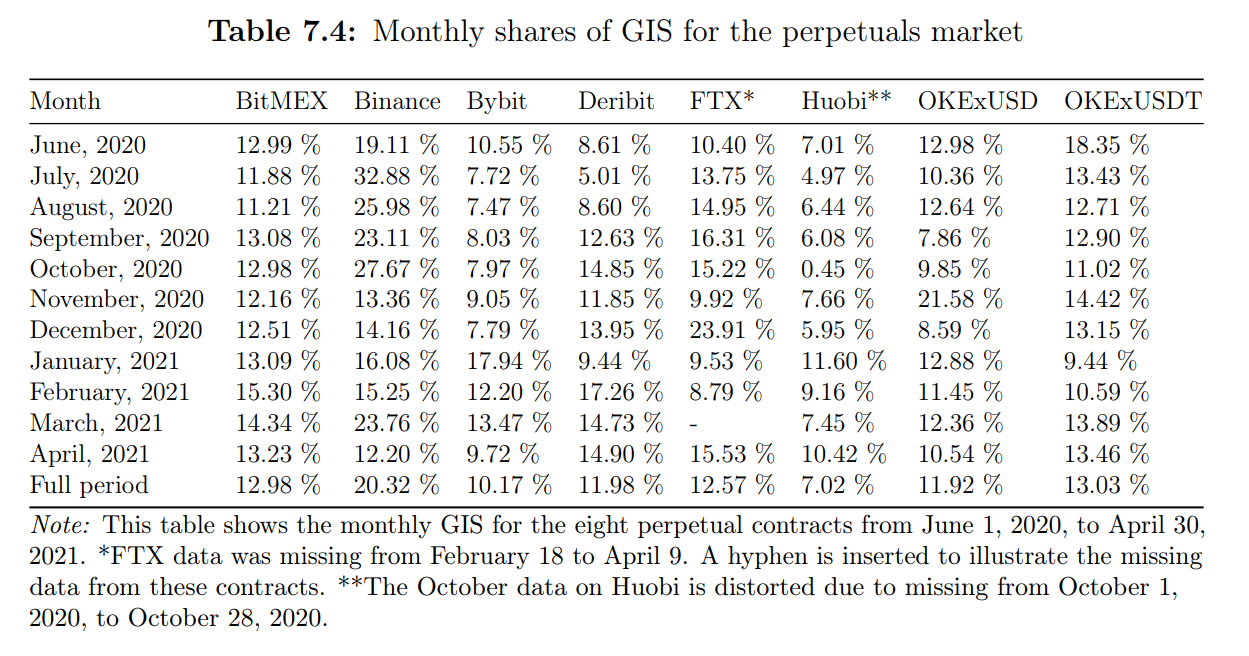
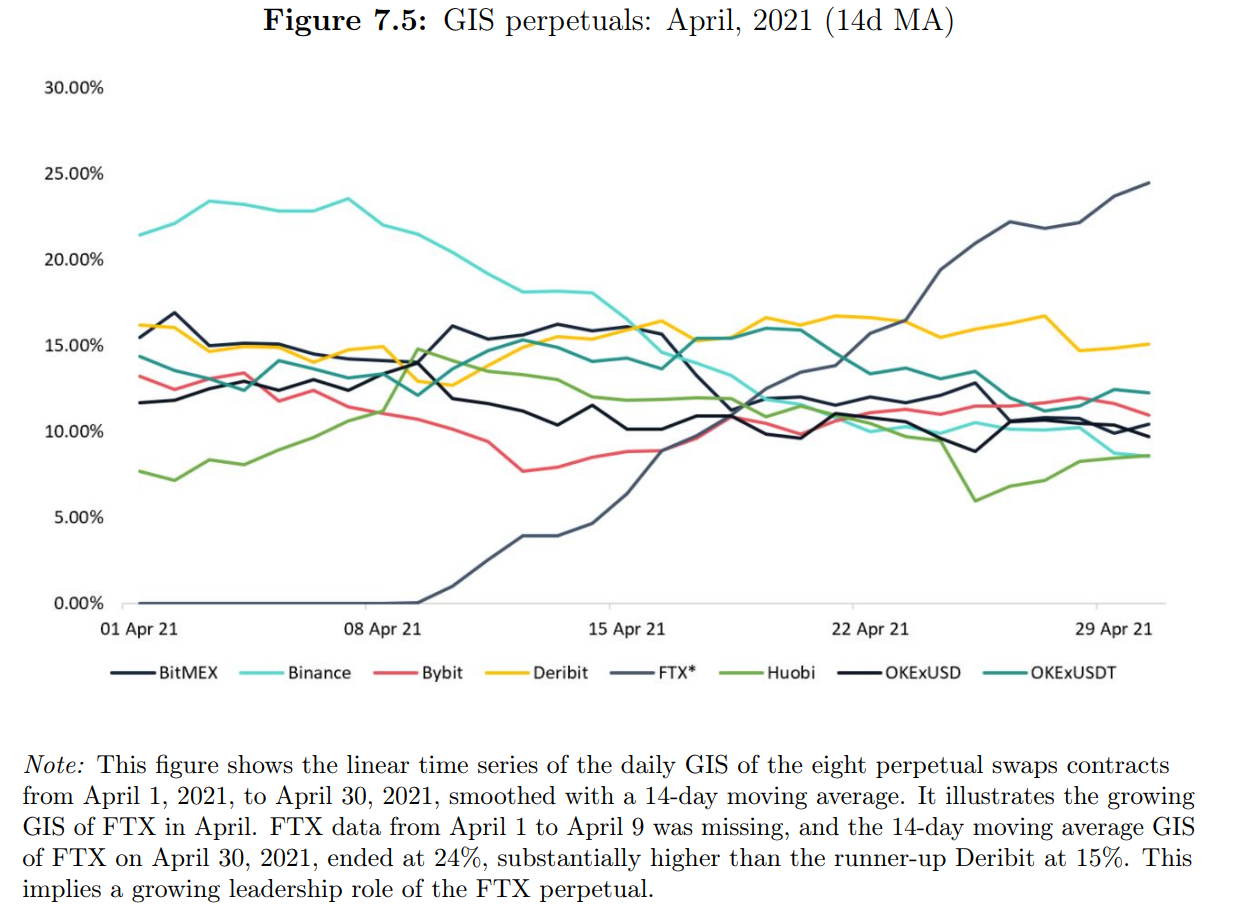
The dataset from the perpetuals market also, unfortunately, missed FTX data. Within the perpetuals, this is more unfortunate than within the futures market, as FTX’s perpetuals seemingly have a growing importance in the price discovery within the perpetuals market in the latter parts of the time series. FTX shows signs of importance in the bitcoin price discovery prior to and following the period with missing FTX data from February 18th to April 9th. Therefore, one should not make any firm conclusions surrounding the leadership role of the FTX perpetuals in the perpetuals marked when looking at the full sample GIS.  Throughout the observation period, Binance’s stablecoin margined perpetual has been the leading instrument among the perpetuals, accounting for 20.32% of the GIS for the entire duration of the sample. Binance saw particularly high GIS in the first five months analyzed before it declined somewhat later. In the latter months of the observation period, the Binance leadership became less pronounced. Binance has only led once in 2021, in March. This is surprising given how Binance has seen the highest trading volume by far among perpetuals, particularly in 2021, with the ADV being above $10 billion for the first four months of 2021.  Likewise, Bybit has the second-lowest GIS of all the perpetuals throughout the sample period, despite the Bybit perpetual seeing the second-highest ADV of all instruments in the perpetuals market. This means that Bybit mainly reacts to price movements in other perpetuals. We attribute this to more uninformed and less sophisticated traders on Bybit.In April, once FTX’s data was once again available in our data set, we found a strong leadership from the perpetual on FTX. This suggests that FTX traders were both more informed and more influential in leading the market once bitcoin saw its bullish momentum decline.
gisftx
Preview
Due to missing data from FTX, the Binance perpetual was the only perpetual added to the main instrument analysis. I hope you enjoyed this blog. Make sure to reach out to me if you have any questions regarding the analysis or seek any comments. My Twitter DMs are open!Link to thesis.
Share this article
Cookies Settings
We use cookies to give you the best experience while using our platform. Some of them are essential, others are optional. We won’t turn them on unless you accept.