company-logoresearch-logo
1 min read
23 Nov 2021

Was $69,000 the peak of this bull market?

The Nov 10th top felt a lot different than the Apr 14th top. While we don’t know if $69,000 will mark the top of this bull run, it’s worthwhile having a look at how certain metrics differed during this peak compared to the Apr 14th peak.
Screenshot 2022-02-02 120033.png
Source: Skew, Tradingview (Coinbase, Upbit), NYDIG
How does the Nov 10th $69,000 peak compare to the $64,899 peak of April 14th? Tl;dr, Bitcoin seemed vastly more frothy in April than it did on Nov 10. I'd be surprised if $69,000 ends up as the peak of this bull run.
The 3-month annualized basis
Futbas1
Preview
Source: Skew
Futbas2
Preview
Source: Skew
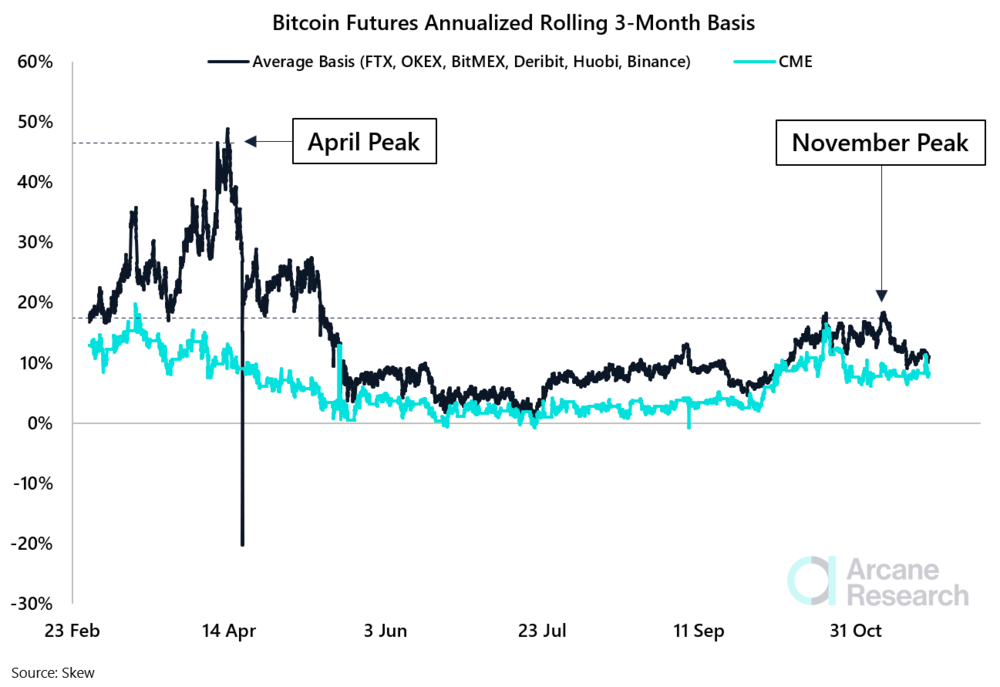
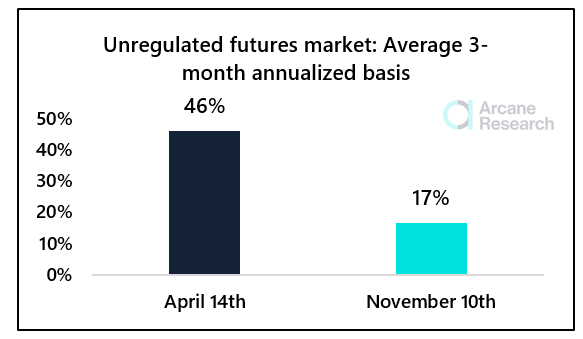
April was indeed the stupidest of times. The market was heavily focused on longing bitcoin, creating enormous cash-and-carry arbitrage opportunities as leveraged trades leaned heavily towards further upside. On Apr 14th, the basis in the unregulated futures market reached 46%. On Nov 10th, we peaked at 17%. Fun fact: From Feb 28th to May 18th, the basis *AVERAGED* at 25.3%!In Sum: The futures basis was far more reasonable in November, not even close to the levels seen earlier this year.
Funding rate
FR1
Preview
Source: NYDIG
FR2
Preview
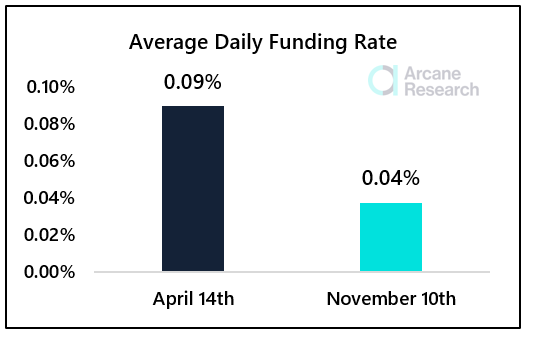
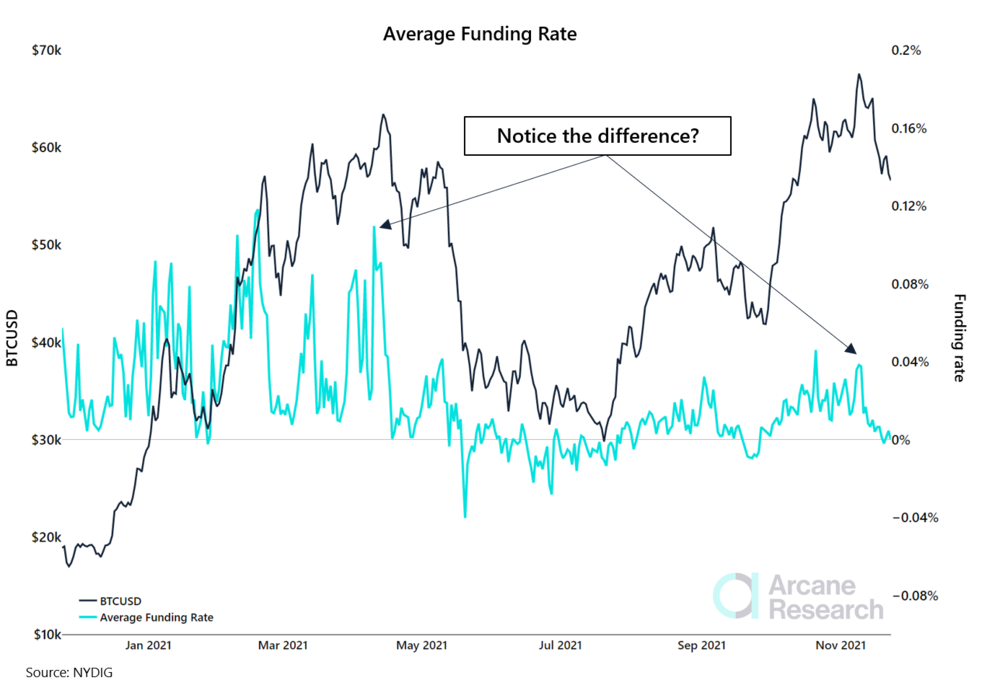
Similar to what we saw in the futures market, the funding rates have been vastly more suppressed this time around. In the good old times of the spring of 21, the funding rates mostly sat above the peak of November. While bullish traders have contributed to driving the price of the perps above spot, the funding rates have remained considerably lower in this bull run, compared to what we saw this spring. This funding rate metric is based on the daily average funding rates from Bitmex, Binance, FTX, and OKEx.
The unregulated offshore futures exchanges vs CME: The basis gap
CMEUN1
Preview
Source: Skew
CMEUN2 (1)
Preview
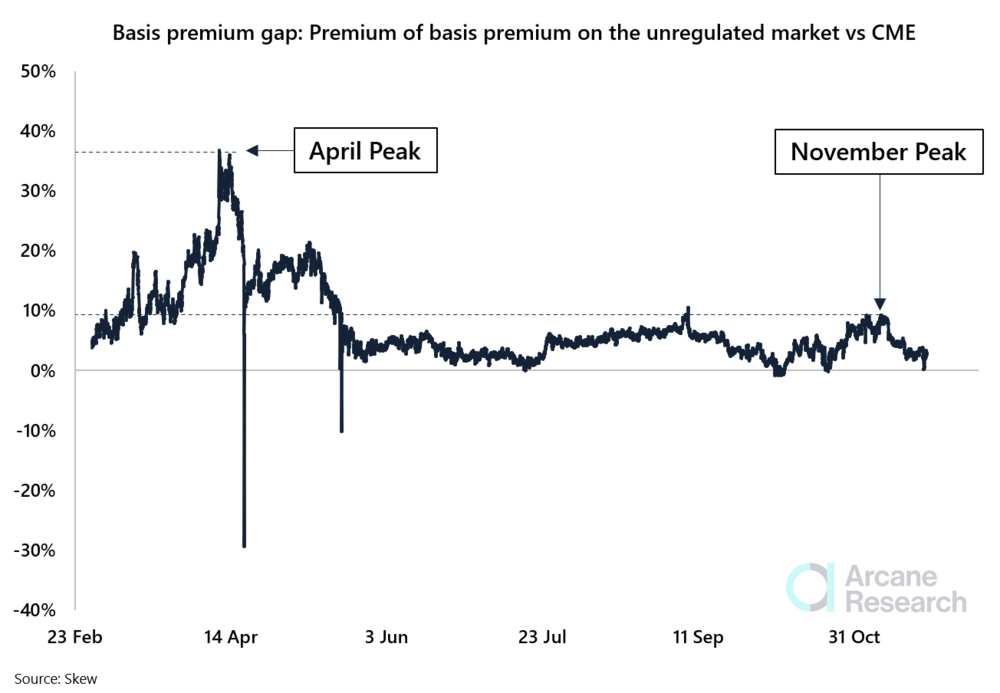
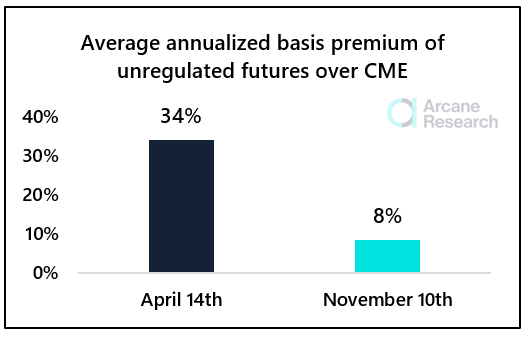
In April, there was no doubt that the bitcoin native traders on the unregulated offshore exchanges were more bullish than the institutional traders on CME. This gap represents a clear inefficiency in the market and represents an obvious arbitrage opportunity. However, large hedge funds are limited to trading at regulated markets, rendering it difficult to take advantage of the free lunch. The CME basis on the other hand is likely influenced by cash-and-carry dynamics, leading the basis, in general, more exposed to cash-and-carry traders, in turn causing a more muted basis premium. This explains the large net shorts from hedge funds in CME’s BTC futures. Apr 14th - Basis unregulated market: 46% - Basis CME: 12% Nov 10th - Basis unregulated market: 16.6% - Basis CME: 8.4%More aligned and efficient pricing of the unregulated vs regulated bitcoin futures is a positive signal, suggesting that the euphoria among bulls has remained relatively muted compared to the carnage seen this spring.
The Kimchi premium
Screenshot 2022-02-02 120937
Preview
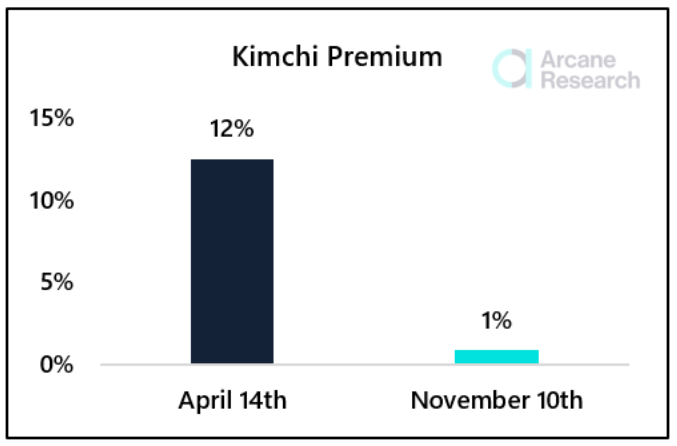
The Kimchi Premium (the price premium of BTC in South Korea over the global market) is a common signal of an overextended market. On April 5th we were concerned about the growing Kimchi premium, comparing how the Kimchi premium had played out in previous occurrences. History repeated itself once more. Once the Korean retail market starts running, you outta be careful! The Nov 10th peak saw a virtually non-existent Kimchi premium, vs the 12% premium seen on April 14th. Yet another sign of a reasonably efficient and healthy market.
Open interest, denominated in BTC.
We prefer denominating the open interest (OI) in BTC. OI measured in BTC makes it easier to interpret the leverage in the market relative to the circulating supply. Thus, we view this indicator as a nice way to gauge the leverage in the market.
OI1
Preview
Source: Skew
OI2
Preview
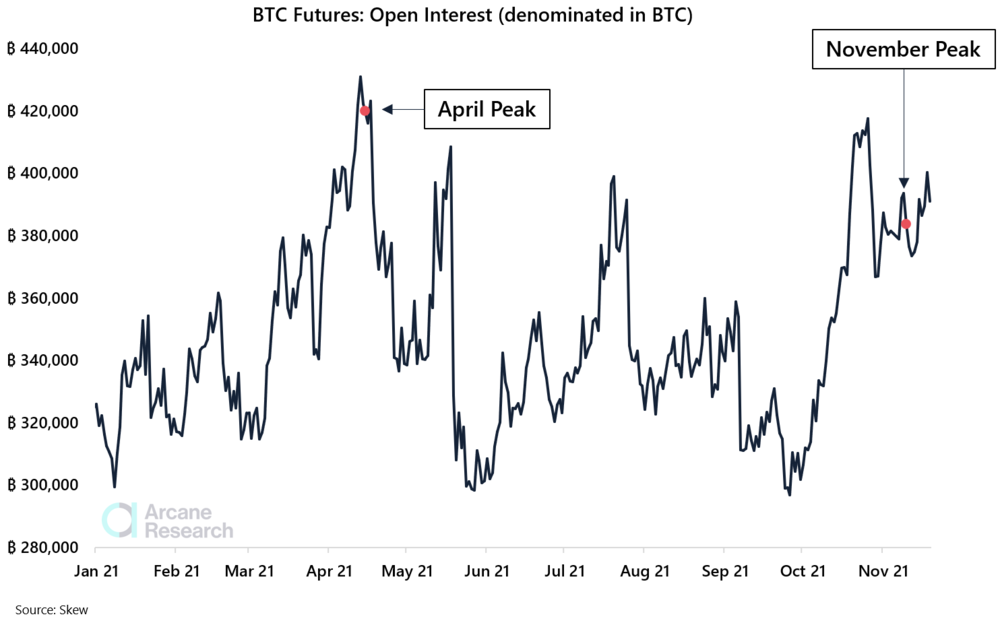
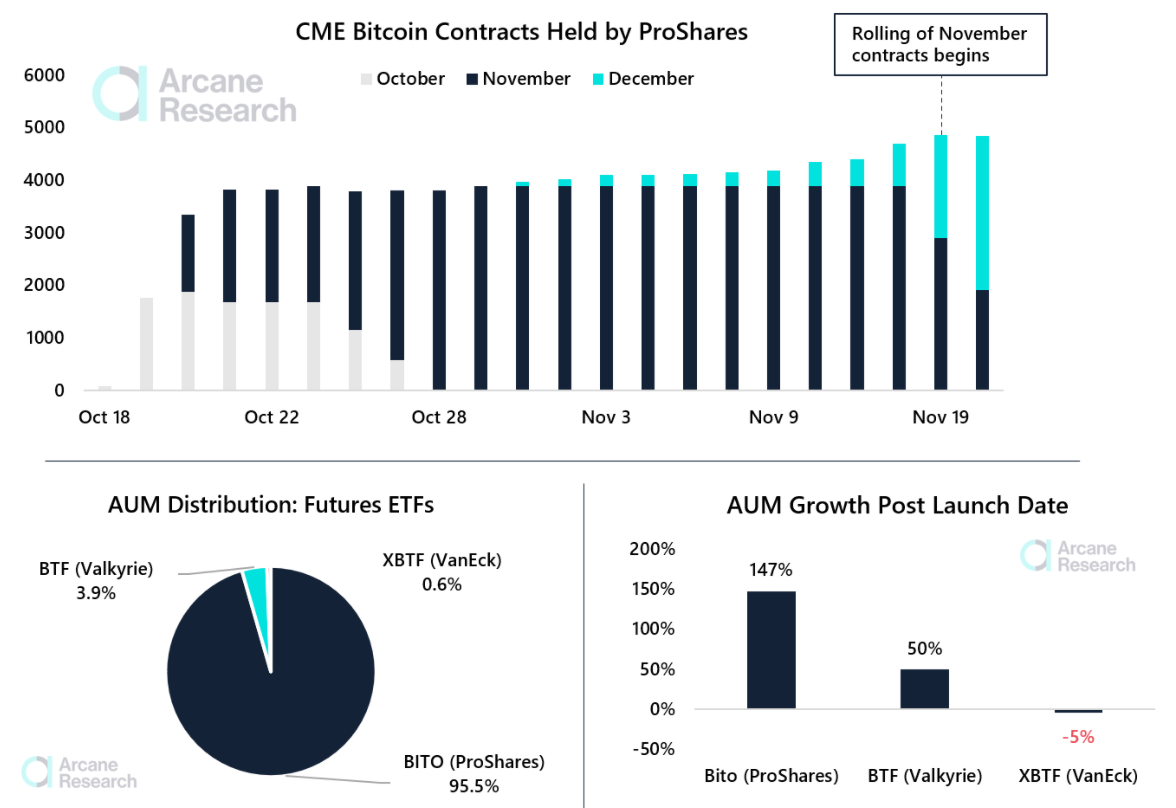
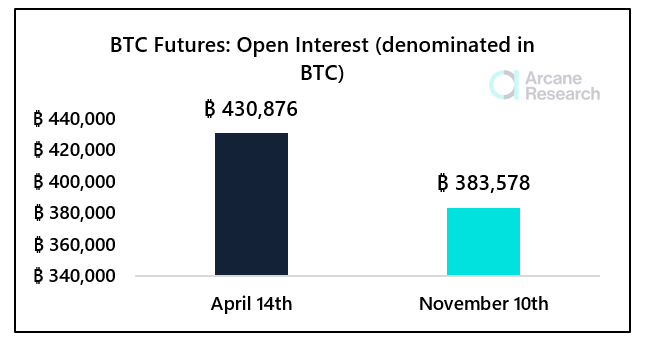
The futures market was extremely leveraged on April 14th, with the BTC denominated OI sitting above 430,000 BTC, almost 50,000 BTC higher than the OI seen on Nov 10th. Nevertheless, the leverage in the market is also clearly high ATM and has seen a sharp growth throughout October. This is not bullish.However, the initial sharp rise in October was primarily caused by CME, with tradfi frontrunning the SEC's ETF response. These ETFs have attracted quite a lot of capital. BITO, in particular, has been extremely successful, forcing them to start rolling their November futures already last Friday, illustrated in the chart below. Today, the fund is wrapping up the roll and will need to add exposure in January contracts due to the maximum limitation of 4,000 contracts per instrument.
Screenshot 2022-02-02 121136
Preview
Source: ProShares, Valkyrie, VanEck
Open interest: A not so pleasant November truth
BB1
Preview
Source: Skew
BB2
Preview
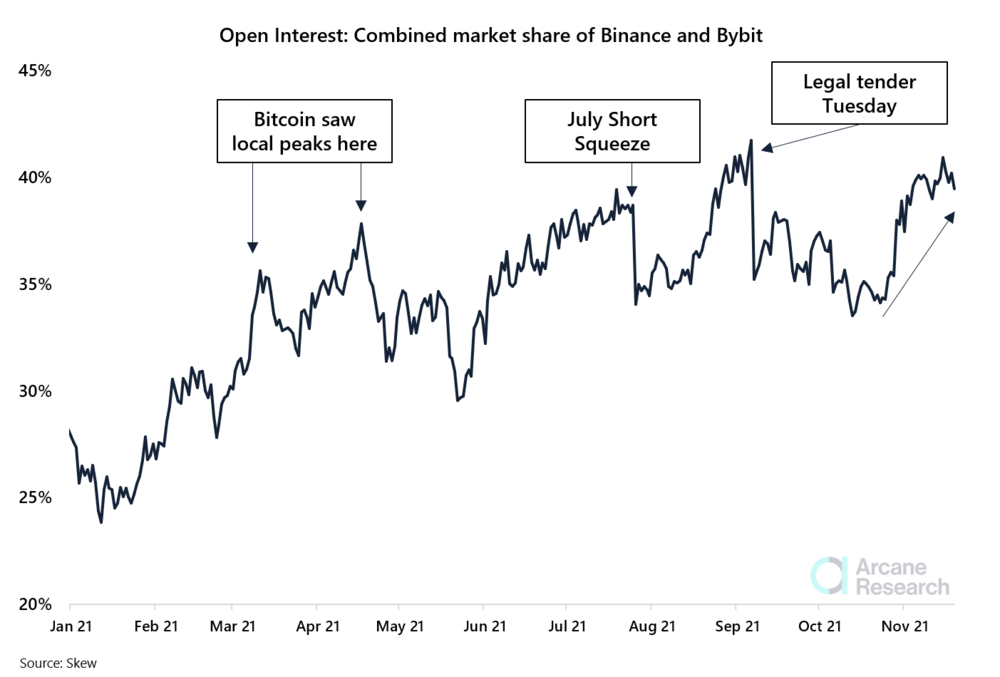
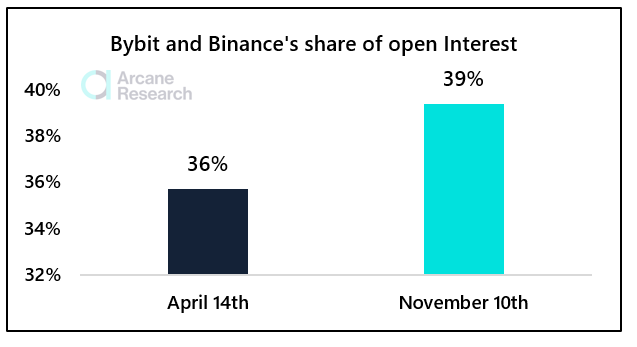
Bybit and Binance's dominance in the BTC futures market reached higher highs than what we saw in April. Traders on these exchanges tend to be particularly vigilant with leverage, and this is concerning. As evident by the time series chart above - In general, you want to counter-trade Bybit and Binance traders. The trend of the open interest on Bybit and Binance is worth monitoring onwards. By also paying attention to whether the perps trade at a premium or discount to spot (influencing the funding rates) and monitoring the futures basis, you can get a sense of how the traders currently behave on these exchanges. The funding rates have neutralized in the last 10 days, suggesting that the market is fairly balanced at the moment, with relatively few traders seeking to buy the dip with leverage.An important side note: Bybit has followed suit with Binance and restricted their liquidation data. Both platforms have restricted their liquidation data, making it more difficult to gauge the impact of cascading liquidations in the futures market. The long liquidation volumes from November are likely a vast underestimation of the real liquidation data from the bitcoin futures market. The lack of transparency from the dominating exchanges in the bitcoin futures market is a bad look for the industry, and we will prioritize finding other methods to gauge the impact of leveraged drawdowns in the future.For good measurement
  • On Feb 23rd, $3.6bn worth of liquidations occurred in the crypto futures market, of which $1.6 billion originated from Binance, meaning that 44% of all liquidations in the BTC futures market originated from Binance. Similar numbers were seen during other infamous long liqs in bitcoin this spring. On Feb 23rd, Binance accounted for 17% of the OI in the BTC futures market.
  • During the Sept 7th crash in Bitcoin, $3.13 bn worth of liquidation occurred in the crypto futures market, of which $1.19bn originated from Bybit, meaning that 38% of all long liquidations originated from Bybit. At the time, Bybit accounted for 16% of the OI in the BTC futures market. (Ps: Binance had already restricted their liquidation data at this point in time).
Based on the calculations above, we can make some naïve estimates to the long liquidations from these exchanges in the last week, let’s use Nov 15th as an example:
  • On November 15th, Coinglass reports a long liquidation volume of $254m in BTC longs.
  • On Nov 15th, Bybit accounted for 16% of the OI in the BTC futures market. Assuming the same relationship from Sept 7th holds, $96 million worth of longs got liquidated on Bybit during this round of liquidation, increasing the real liquidation volumes to $350 million in the BTC futures market.
  • Binance, on the other hand, had increased its market share to 25% of the OI in the BTC futures market (From 17% on Feb 23rd). Assuming naïvely that the relationships mentioned above remain, I make the following back-of-the-envelope calculations of the Binance long liqs on Nov 15th:$350m * (1+0.44) * (25%/17%) -$350m = $391m.
  • This sums up to a total long liquidation volume of $742m on November 15th, quite a lot higher than $254m, eh?
I must once again emphasize that the calculations above are no exact science, it’s a back-of-the-envelope calculation. Nevertheless, as exchanges chose to obfuscate liquidation data, guestimations are the best option onwards.
Why are we seeing less frothy signals in BTC in Nov vs April?
1. Retail speculates in meme-coins rather than being burned once again by leverage. In other words, shitcoinism could benefit bitcoin.2. More active market makers contribute to less frothy funding rates/basis through basis trades. While this could be true, this would balloon the BTC denominated OI to even higher levels than what we saw in April. So this does not seem like a likely explanation as of now. When all things are said and done, I personally do not think the top is in. The market can get a lot stupider than what we've seen so far. Nevertheless, I ain't no fortune teller! DYOR.
Share this article
Cookies Settings
We use cookies to give you the best experience while using our platform. Some of them are essential, others are optional. We won’t turn them on unless you accept.